$754,500
2 beds 2 full baths 1,563 sq ft
HOA: $286 monthly as of October 11, 2026 (this listing's reported figure). Built 2024. Listed by eXp Realty of California, Inc..
Subject to prior sale.
Earlier edition: August 2026 report
Report date: October 11, 2026
When Rutsell and I look at Regency at Folsom Ranch this month, the picture is clear: one home closed at $895,000, and the widget's overview shows 13 on the market (12 active, 1 contingent), with a median asking price of $985,000.
Every number below reflects MLS data for the 30 days before October 11, 2026.
Median Sold Price
$895,000
Across the 1 closed sale shown.
Median Active Asking Price
$985,000
Across the 13 on the market (12 active, 1 contingent) shown.
Median New Listing Price
$1,049,000
Across the 1 new listing shown.
Sale-to-List Price Ratio
99%
The widget's 30-day overview figure, not the ratio of the single closed sale.
Median Days on Site (Active)
66
The reported median for active listings; no value is shown for new or sold.
On Market
13
(12 active, 1 contingent)
Closed Sales
1
Shown in the current inventory.
New Listings
1
Shown in the current inventory.
Most of the homes for sale in Regency at Folsom Ranch right now are being sold by the builder, Toll Brothers. Several of them are its model homes, and that is the main reason asking prices look so high this month.
Model homes are the showpieces of a new community. Toll Brothers builds them to show off what its homes can be, with premium designer finishes, upgraded features and furnishings, and often some of the best lots. They are dream homes, and they are priced that way.
As of October 11, 2026, 8 of the 12 active homes are listed by Toll Brothers' own brokerage. At least three of them are described in their listings as model homes:
Only 4 of the 12 active homes are resales offered by other agents. They are priced from $754,500 to $1,050,000.
What this means for the numbers: The median asking price of $985,000 mostly reflects builder and model-home pricing. It does not show what a typical resale home is worth. Recent sale prices tell a different story: the median sold price was $657,500 in August and $740,000 in September, and the one sale in the last 30 days closed at $895,000. When model homes are part of what's for sale, asking prices can rise without resale values rising with them.
If you're selling a resale home here, it should be priced against recent resales, not against the model homes. If you're buying, the model homes offer upgrades you won't usually find in a resale, and the resales offer a lower price.
The monthly figures below, April through September 2026, come from the charts on the Regency at Folsom Ranch community page. The monthly figures shown in the source charts are in the tables below the charts.
The active median rose when Toll Brothers listings, including model homes, became most of the homes for sale.
Monthly chart counts are history, not today's inventory. Asking and sold medians by month, April through September 2026.
The bold line at 100% marks the full asking price.
Monthly chart counts are history, not today's inventory. The reported sale-to-list ratio by month, April through September 2026.
The reported median days on site for active listings, by month.
Monthly chart counts are history, not today's inventory. The reported median days on site for active listings by month. In June, the widget displayed 0, which most likely means no data rather than a real zero.
Monthly chart counts are history, not today's inventory. Active listings and closed sales by month, April through September 2026.
* Data on active listings begins accruing at report creation. History will grow over time.
In the June chart, the widget displayed 0 median days on site, which most likely means no data rather than a real zero.
The precise figures behind the charts above, April through September 2026.
Median asking and sold prices, the sale-to-list ratio, and days on site by month.
| Month | Active median | Sold median | Sale-to-list ratio | Days on site |
|---|---|---|---|---|
| Apr | Active median $880,000 | Sold median $649,000 | Sale-to-list ratio 97.59% | Days on site 50 |
| May | Active median $792,000 | Sold median $927,000 | Sale-to-list ratio 98.63% | Days on site 11 |
| Jun | Active median $724,000 | Sold median $799,900 | Sale-to-list ratio 97.38% | Days on site No data |
| Jul | Active median $711,500 | Sold median $786,000 | Sale-to-list ratio 97.36% | Days on site 44 |
| Aug | Active median $1,017,500 | Sold median $657,500 | Sale-to-list ratio 96.91% | Days on site 25 |
| Sep | Active median $1,017,000 | Sold median $740,000 | Sale-to-list ratio 99.39% | Days on site 55 |
Active listings and closed sales by month.
| Month | Active listings | Closed sales |
|---|---|---|
| Apr | Active listings 3 | Closed sales 3 |
| May | Active listings 6 | Closed sales 4 |
| Jun | Active listings 11 | Closed sales 5 |
| Jul | Active listings 3 | Closed sales 6 |
| Aug | Active listings 9 | Closed sales 9 |
| Sep | Active listings 2 | Closed sales 2 |
The one closed sale shown in the 30 days before October 11, 2026.
Folsom, CA 95630 · MLS #226110937
$895,000
Closed October 9, 2026. List price $925,000, sold price $895,000. Listed by RE/MAX Gold Folsom; selling office Coldwell Banker Realty. Subdivision "Regency at Folsom Ranch", builder Toll Brothers (2022). Close date as displayed on the sold listing record.
One closed sale is a single data point, not proof of value for any other home in the community.
Twelve live listings from the October 11, 2026 snapshot, all confirmed as active on their detail pages. HOA fees are shown exactly as each listing reports them, with the cadence each listing reports. Click any address to open the full listing on NorCal55Plus.com.
About the count: the community page's "Active 13" tile equals 12 fully active homes plus 1 contingent home, matching the live tile's "13 results". Total listing activity at research time was 16: 12 active, 1 contingent, 2 pending, 1 sold. This report is a dated snapshot of that research, not a complete record of the live feed.
$754,500
HOA: $286 monthly as of October 11, 2026 (this listing's reported figure). Built 2024. Listed by eXp Realty of California, Inc..
Subject to prior sale.
$885,000
HOA: $286 monthly as of October 11, 2026 (this listing's reported figure). Built 2021. Listed by Toll Brothers Real Estate, Inc.
Subject to prior sale.
$890,000
HOA: $286 monthly as of October 11, 2026 (this listing's reported figure). Built 2021. Listed by Toll Brothers Real Estate, Inc.
Subject to prior sale.
$950,000
HOA: $285 monthly as of October 11, 2026 (this listing's reported figure). Built 2022. Listed by Keller Williams Realty.
Subject to prior sale.
$959,000
HOA: $121 monthly as of October 11, 2026 (this listing's reported figure). Built 2026. Listed by Toll Brothers Real Estate, Inc.
The widget counts 3603 Black Sage St as active, but its subdivision is 'Folsom Ranch-Preserve' with a $121 HOA, so it may not sit in the 55+ section. Without it, the community has 11 active homes.
Subject to prior sale.
$960,000
HOA: $286 monthly as of October 11, 2026 (this listing's reported figure). Built 2021. Listed by Toll Brothers Real Estate, Inc.
Subject to prior sale.
$985,000
HOA: $286 monthly as of October 11, 2026 (this listing's reported figure). Built 2021. Listed by Toll Brothers Real Estate, Inc.
Subject to prior sale.
$1,049,000
HOA: $285 monthly as of October 11, 2026 (this listing's reported figure). Built 2024. Listed by Intero Real Estate Services.
Subject to prior sale.
$1,050,000
HOA: $286 monthly as of October 11, 2026 (this listing's reported figure). Built 2024. Listed by eXp Realty of California, Inc..
Subject to prior sale.
$1,135,000
HOA: $286 monthly as of October 11, 2026 (this listing's reported figure). Built 2026. Listed by Toll Brothers Real Estate, Inc.
Subject to prior sale.
$1,790,000
HOA: $286 monthly as of October 11, 2026 (this listing's reported figure). Built 2021. Listed by Toll Brothers Real Estate, Inc.
Subject to prior sale.
$1,850,000
HOA: $286 monthly as of October 11, 2026 (this listing's reported figure). Built 2021. Listed by Toll Brothers Real Estate, Inc.
Subject to prior sale.
These listings were available for sale as of October 11, 2026. This page is not updated over time. If you are viewing it later, some or all of these homes may already have sold.
3532 Panorama Dr, $1,079,000, 2 beds / 2.5 baths / 2,316 sq ft, MLS #226084248, is now contingent and not counted as available.
4152 Meadow Crest Dr ($1,105,000, MLS #226077957) and 4038 Sunny Oaks Dr ($799,950, MLS #226117473) are pending and not counted as available.
This month's snapshot shows just 1 closed sale and 13 on the market (12 active, 1 contingent) with a reported 66 median days on site, so the sample is small and homes are taking time to sell. Most active inventory is Toll Brothers new construction, so a resale list price should be set against the closest comparable resales and current new-build pricing.
If you're considering selling in Regency at Folsom Ranch, talk with Gary and Rutsell about representing you and building a pricing and launch plan for your specific home.
Buyers have 12 active homes (plus 1 contingent) per the verified October 11, 2026 snapshot, across a wide price range ($754,500 to $1,850,000 among the homes highlighted). The widget's 30-day overview reports a 99% sale-to-list ratio, which is context, not an offer formula; the one closed sale listed at $925,000 and sold for $895,000. For the complete current inventory, check the live listing feed, then compare floor plans, lots, and HOA structures and arrange a showing for the homes that fit.
If you're considering buying in Regency at Folsom Ranch, talk with Gary and Rutsell about buyer representation, comparing available homes, and arranging a private showing.
Gary and Rutsell Lee can represent sellers and buyers in this 55+ community. Request a home-value review for your home, or request a showing or buyer consultation for the homes you want to see. Both forms go straight to Gary and Rutsell.
For sellers
A home in a 55+ community is more than its square footage and bedroom count. Gary and Rutsell consider the floor plan, upgrades, lot and location, current competition, and the lifestyle buyers are choosing when they look at this community.
For buyers
Tell us what you're hoping to find. We can help you review homes here, arrange a private showing, and explore nearby 55+ communities if you're open to other locations.
This report is a dated snapshot, not a live feed. Use the links below for current listings, open houses, and every monthly report.
This report was re-verified live on October 11, 2026 at 12:43 PM PT, when all 16 listings were opened on their detail pages. Market statistics and listing examples are based on MetroList data; the data stamp reads either 10:06 AM PT or 11:48 AM PT on October 11, 2026, depending on the listing, covering the 30 days before those timestamps. The community page displays a live feed with no data timestamp and a "UPDATED 2026" marker. Listing details are a dated snapshot and may have changed; use the live listings and open-house links for current availability. MLS information is deemed reliable but not guaranteed. Community-wide statistics are not an appraisal or valuation of a specific home. This independent report is for buyers and sellers and is not affiliated with the HOA or any builder or developer.
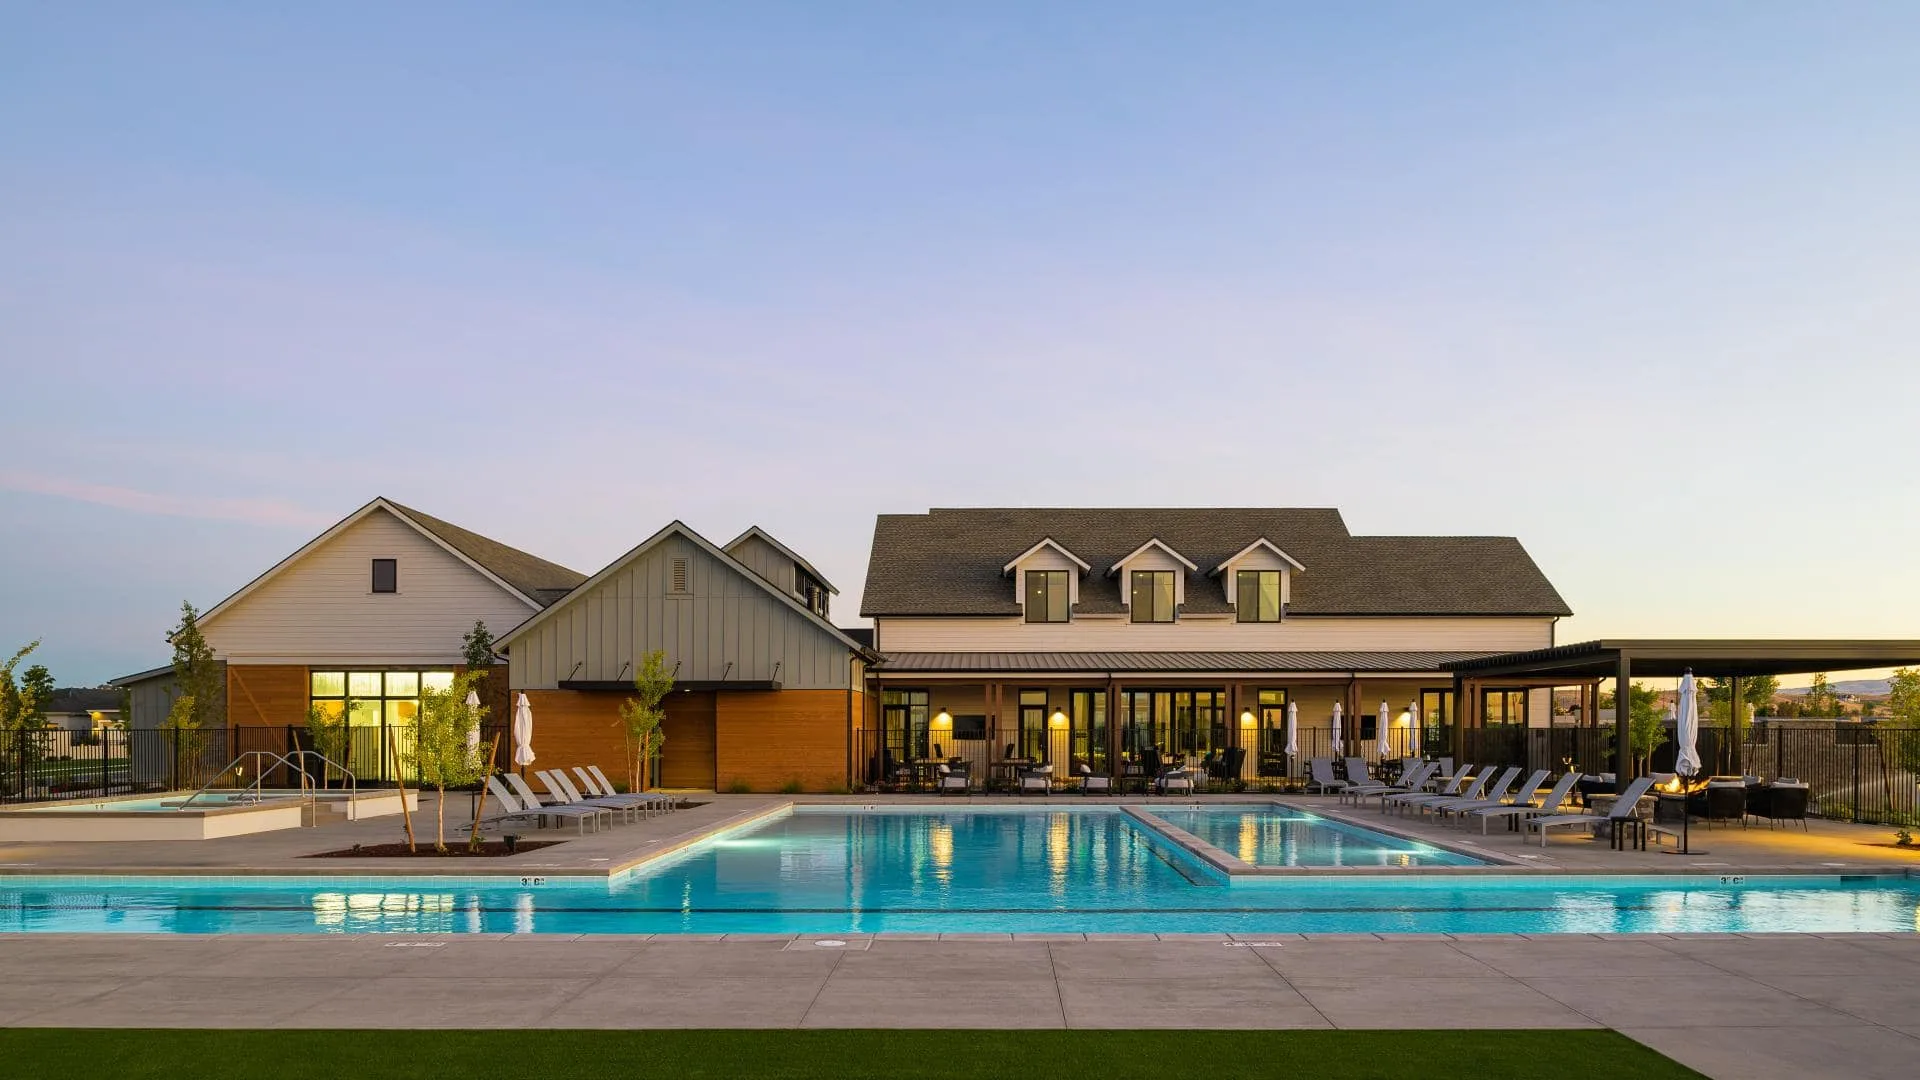
The hero photo's original file carries a different community name, so the team is confirming it shows Regency at Folsom Ranch.
Quick answers to the questions buyers ask most about this report.
The report shows 13 active listings with a median asking price of $985,000, 1 closed sale at $895,000, a reported 99% sale-to-list ratio, and a reported 66 median days on site for active listings. One new listing was also shown, at a $1,049,000 median new-listing price.
The community page's "Active 13" tile equals 12 fully active homes plus 1 contingent home, matching the live tile's "13 results". Total listing activity at research time was 16: 12 active, 1 contingent, 2 pending, 1 sold.
June shows 0 median days on site, which most likely means no data rather than a real value of zero. It is labeled "No data" on the chart, and the monthly chart counts are history, not today's inventory.
HOA fees are shown exactly as each listing reports them, with the cadence each listing reports, for example "$286 monthly as of October 11, 2026".
It is uncertain. The widget counts 3603 Black Sage St as active, but its subdivision is "Folsom Ranch-Preserve" with a $121 HOA, so it may not sit in the 55+ section. Without it, the community has 11 active homes.
Current availability lives in the live listing feed on the Regency at Folsom Ranch community page, which updates on a schedule and can change at any time.